Русский


Based on current GDP growth trends, the Russian-backed Commonwealth of Independent States is likely to reach GDP economic parity with the European Union and may even overtake it, by 2050.
The current GDP (PPP) of the European Union is €25.09 trillion, with a current average growth rate, according to the World Bank, of 1.2%. The current GDP (PPP) of the Commonwealth of Independent States (CIS) is €8.08 trillion, with an average current growth rate of 5%. Based on these current growth rates, it will take the CIS 14 years to reach 50% of the economic size of the EU, but just a further decade to reach economic parity. This could be achieved earlier, if the economic development advantages and disadvantages continue to persist over this timescale.
Calculations Methodology

The basic math used to calculate these findings are as follows (calculations were originally performed in USD values. Euro values quoted in this article are made at the current exchange rate).
1. Calculate half of the EU’s GDP:
- Half of EU’s GDP (29.2 trillion) is 29.2 / 2 = 14.6 trillion.
2. Calculate the difference between CIS GDP and half of EU GDP:
- The difference is 14.6 – 9.4 = 5.2 trillion.
3. Calculate how long it will take CIS to reach half of the EU GDP:
- Using the rule of 72 for exponential growth, we can approximate the doubling time for CIS GDP: 72 / 5 = 14.4 years (approximately).
- Since CIS needs to grow by 5.2 trillion, which is less than the initial GDP, it will take less than 14.4 years.
- After 14 years, CIS GDP will be approximately 9.4 * (1.05)^14 = 18.6 trillion.
- After 14 years, half of EU’s GDP will be approximately 14.6 trillion.
- Therefore, CIS will reach half of EU’s GDP in approximately 14 years.
4. Calculate how long it will take CIS to reach the EU’s full GDP:
- After reaching half of the EU’s GDP, CIS needs to grow by another 14.6 trillion.
- Using the rule of 72 again, the doubling time for 14.6 trillion will be 14.4 years.
- Since CIS needs to grow by half of its current GDP, it will take another 10 years to reach the EU’s full GDP.
Total Time For CIS To Reach EU Economic Parity: 24 years.
EU v CIS Demographic and Structural Fundamentals
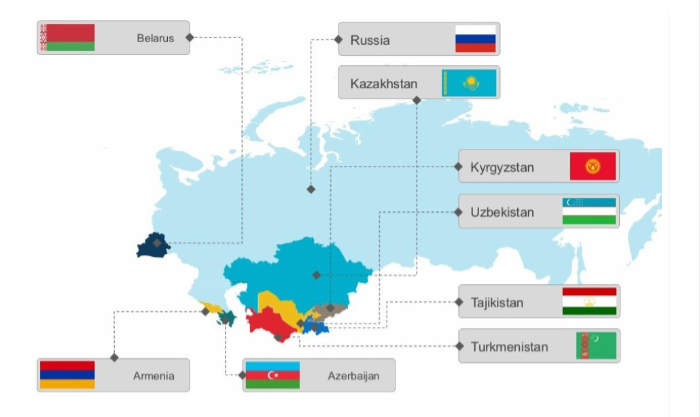
The European Union has 28 member countries: Austria, Belgium, Bulgaria, Croatia, Cyprus, Czech Republic, Denmark, Estonia, Finland, France, Germany, Greece, Hungary, Ireland, Italy, Latvia, Lithuania, Luxembourg, Malta, Netherlands, Poland, Portugal, Romania, Slovakia, Slovenia, Spain and Sweden. The total population is 450.4 million.
The Commonwealth of Independent States has 9 member countries: Armenia, Azerbaijan, Belarus, Kazakhstan, Kyrgyzstan, Russia, Tajikistan, Turkmenistan, Uzbekistan (it should be noted that Turkmenistan is an ‘associate’ member but follows CIS trade regulations). The total population is 253.6 million.
In terms of regulatory make up however, they are rather different. The CIS doesn’t have a rigid set of intra-trading regulations and tariffs on a uniform basis. It also does not have a common currency, with members free to use their own respective monies. This has had two effects, one being a more liberal trade policy, where CIS members agree their own bilateral trade arrangements rather than a complex set of regulations that unify all. Secondly, the use of sovereign currencies rather than a singular regional one has also proven to be more flexible as local dynamics can reflect real value at any one time. In short, the CIS arrangements provide more flexibility.
However, because the CIS is not a customs union per se, it cannot (and does not) enter into Free Trade Agreements with other countries or blocs.
Trade Agreements

It should also be noted that several of the CIS members are also members of the Eurasian Economic Union (EAEU) which does have specific intra-bloc customs and tariffs agreements. These are Armenia, Belarus, Kazakhstan, Kyrgyzstan, and Russia. Uzbekistan is also considering joining this group and has gone as far as to become an observer state.
The EAEU has signed Free Trade Agreements (FTA) with China, Vietnam, Iran, and Serbia and is currently in negotiations with India, Indonesia, Egypt and the UAE amongst others. However, these FTA can also be flexible. The EAEU-China FTA is non-preferential, meaning that decisions on products and tariffs can be made on an ‘as need’ basis without the requirement to enter into lengthy, multi-year negotiations. The BRICS operates its bloc trade agreements under similar principles. This has already proven to be advantageous when dealing with sanctions and the unpredictable nature of US President Trump’s administration in changing tariffs from one week to the next.
In contrast, the EU has a rigid set of intra-bloc trade agreements that are centrally imposed from Brussels and do not always reflect individual members wishes. The recent stand-off between Brussels and EU members Hungary and Slovakia is illustrative. The EU has also found itself to some extent in the same position as Russia – with the United States also imposing trade tariffs upon it.
In addition, the EU failed to maintain its Comprehensive Agreement on Investment (CAI) with China, which was terminated after 5 months of being in force and a seven year-long negotiation process, a decision that immensely frustrated Beijing.
These types of attitudes remain prevalent within the EU and remain a hinderance to developing trade. One example of this is Lithuania’s diplomatic decision to punish Beijing for its alleged ill-treatment of Chinese Muslims in Xinjiang Province. Vilnius closed its Chinese Embassy in Beijing and opened up an official trade office in Taiwan as an alternative. In response, Beijing terminated its bilateral trade with Lithuania. This resulted in what had been a 20 year long partnership of Lithuania-China trade worth €3 billion in Lithuanian exports, being replaced with €2 million of Lithuanian exports to Taiwan – and most of that being resold products (such as ‘Lithuanian Rum’) manufactured in non-EU countries.
The EU has also not reached any Free Trade agreement with India and isn’t expected to for some time. Meanwhile, the proposed EAEU-India agreement is its reaching final stages, with a conclusion expected in late 2025 to mid-2026.
There are similar situations developing with EU and CIS respective free trade negotiations with Indonesia, and the UAE. Collectively the consumer markets of China, India, Indonesia, Egypt and the UAE alone have populations of 3.289 billion. Yet it appears that the CIS loose style of trade agreements means such deals are more rapidly concluded and are rather more flexible. If this difference in structured negotiations continues, and the EAEU members continue to develop their multilateral trade relations with countries such as these, while the EU remains rather more rigid in their approach, then this could further accelerate CIS growth over the EU.
Decision-Making
It should also be pointed out that the CIS, EAEU and BRICS all hold rotating Presidencies (as does the Shanghai Cooperation Organisation), with each member taking on the role for twelve months at a time. While the EU has the same structure, due to its size, it limits this to just 6 monthly periods, which compacts and reduces effectiveness. In addition, the EU appoints a select European Commission, based in Brussels to take decisions. This commission does not include all EU member states, which has limited decision taking to a very select group. This has resulted in a narrow range of opinions directing the EU, which have tended to override wider regional populist views.
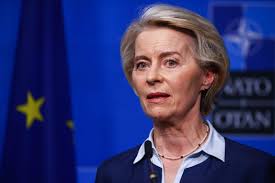
In contrast, the CIS, while it also has an executive decision-making committee to coordinate decisions, refers trade discussions via its multilateral foreign ministerial structures, and leaves these alone to perform their functions. It does not overrule or direct agreements made at ministerial level. As we have recently seen, the EC commissioner, Ursula Von Der Leyen, has the ability to direct hundreds of billions of euros of trade based upon her personal decisions.
There are other, obvious differences. The EU has 28 member states to consider, meaning the decision-making policy can be frustrating and time consuming. EU bureaucracy is also regarded as substantial. With the CIS currently at 9 members, and possessing a rather slimmer administrative structure, it appears to be able to react in somewhat faster timeframes, a position that can be expected to stand it in good stead during times of political and economic uncertainty.
Energy Costs

Key to the development of both the European Union and the CIS is the issue of energy supplies. The EU has committed to reducing its consumption of Russia energy, and wanting to reduce, via sanctions, the abilities of other countries to purchase Russian oil at prices above US$45-50 a barrel, while remaining based on market prices. This has two effects; reducing the fiscal income that Russia obtains, while also keeping oil supply costs low. This has had some success – but is dependent upon the EU being able to maintain and hold this pressure and price caps. However, it can be breached due to other circumstances – such as conflict with Iran. Any interference with supply chains via the Strait of Hormuz can dramatically impact oil prices – they rose briefly to over US$80 a barrel during the recent conflict with Israel. This price cap is also subject to other countries agreeing to follow the EU directive. Resistance is also beginning to appear, as an oil price cap places the EU’s sanctions policies in conflict with the major global OPEC and OPEC+ suppliers. At present they are amenable, but in time this could change. Oil and petroleum products are used by about 10% of the EU’s total industrial energy base.
In terms of gas, the EU has internal conflicts as regards its stated intentions of reducing Russian LNG imports to zero by 2027 as several eastern EU nations are dependent upon it. The EU is 30% dependent on gas supplies for domestic users, with a lack of alternative sources meaning that changing supply chains (buying from the US for example) has led to significant price increases that directly affect the EU population. This problem is especially manifested in the winter months.
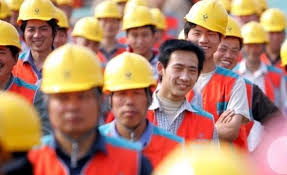
The impact of energy sanctions upon the EU’s domestic economy is hard to establish as the EU does not provide any reasonable data to determine a decline of Russian sourced products equating to industrial output or increasing costs. However, there are some illustrative economic indicators that can be used to imply there has been a significant impact. For example, the EU’s average GDP growth (industrial output) in 2021 was 6%, in 2022 it was 3.4%, but declined 0.3% in 2023 when the impact of sanctions upon Russia began to be felt. In 2024 it was 1%.
The Purchasing Managers Index (PMI) is also a reliable economic indicator as it displays market opinions (physical orders across a variety of industrial sectors) as to productivity. Any level above 50 is an expansion, any below that is contraction. In 2021, the EU average was 58.6, a strong indicator. In 2022, 2023, and 2024 it remained below 50, showing constant contraction of demand.
The performance of the top five largest EU economies in terms of their own growth is also telling:
| Country & GDP Growth% | 2021 | 2022 | 2023 | 2024 |
| France | +6.9 | +2.6 | +0.9 | +0.8 |
| Germany | +3.7 | +1.4 | -0.3 | -0.2 |
| Italy | +8.9 | +4.7 | +0.7 | +0.7 |
| Spain | +6.7 | +6.2 | +2.7 | +3.2 |
| Netherlands | +6.3 | +5.0 | +0.1 | +0.9 |
All have shown significant contraction over the past four years, with Germany entering recession.
We can contrast this with the top five largest CIS economies over the same period.
Country & GDP Growth%
| Russia | +5.6 | -2.1 | +3.6 | +4.1 |
| Kazakhstan | +4.3 | +3.2 | +5.1 | +4.8 |
| Belarus | +2.4 | -4.7 | +3.9 | +4.0 |
| Uzbekistan | +8.0 | +6.0 | +6.3 | +6.5 |
| Azerbaijan | +5.6 | +4.7 | +1.1 | +4.1 |
It should be noted that during this period, both Russia and Belarus were specifically subjected to sanctions by the EU designed to limit their trading capability. This is reflected in their 2022 data. Also of note is the impact of conflict upon Azerbaijan, whose growth suffered in 2023 due to a regional war with Armenia.
While there are no specific data sets that refer to a decline in European productivity due to the impact of energy sanctions, other relevant data suggests that this is indeed the case. It also appears apparent that the cheaper energy supplies the CIS member states are able to obtain are driving their economies ahead, whereas the EU is in decline. If this continues over a prolonged period, the CIS ability to match EU GDP volumes can be expected to happen at within an earlier timeframe than the 2050 suggested.
Infrastructure Development

Significant gaps are also appearing in infrastructure development when comparing the EU and the CIS. An important additional component factor here is China’s Belt & Road Initiative and the economic investment it has made into the CIS countries. It has, in contrast, made little investment into Europe. The EU, as part of the G7 did announce its own ‘Global Gateway’ initiative at which US$600 billion was pledged to spend on emerging markets. It is unclear how much of this has actually been allocated.
The EU has also just made proposals to spend €2 trillion on defence, security and innovation, although curiously, there is no specific mention of infrastructure development.
These announcements remain somewhat ambiguous, and it remains difficult to assess what they really mean and what is included. The EU is also non-transparent in terms of where money will, or has been spend on practical projects.
We find that the CIS countries are rather more open about this. They also have the benefit of having received infrastructure development funding from China, with estimates that Beijing has spent about US$100 billion on BRI investments into CIS countries, and possibly more. In terms of the individual CIS nations, a brief snapshot reveals significant plans:
Armenia

The Armenian government intends to allocate US$1 billion annually for infrastructure projects and is actively investing in infrastructure development with a focus on transport, specifically road construction and upgrades. The Armenian government is allocating a significant portion of its budget to these projects, including a substantial increase for transport infrastructure improvements in 2023. Additionally, international loans are being secured to fund major projects like the Sisian-Kajaran road and the Kajaran Tunnel, which are part of the International North-South Transport Corridor.
Azerbaijan
Azerbaijan is heavily investing in infrastructure development, particularly in reconstruction efforts in liberated territories and energy projects. The government has allocated significant funds for these purposes, with a strong focus on energy security, renewable energy, and transportation. Additionally, international financial institutions like the World Bank and ADB are providing support for these initiatives.
Belarus
Belarus has prioritized infrastructure development, allocating significant funding through state and regional investment programs. A key goal is to enhance engineering, transport, and social infrastructure, with a focus on building and expanding these areas. The state investment program accounts for a substantial portion of the allocated funds, with regional programs contributing as well. Additionally, the Belarus-Russia Union State budget also includes funding for infrastructure projects, demonstrating a commitment to cross-border infrastructure development.
Kazakhstan
Kazakhstan has a significant national infrastructure plan, running until 2029, with a budget of approximately US$80 billion. This plan encompasses over 200 projects across various sectors, including energy, transport, digital infrastructure, and sanitation. The country is actively working on modernizing its transport infrastructure, particularly roads and railways, to strengthen its position as a regional logistics hub.
Kyrgyzstan
Kyrgyzstan is actively working on developing its infrastructure, with significant investments in energy, transport, and urban development. The country is receiving support from international organizations like the World Bank and the EBRD to implement reforms and projects aimed at boosting economic growth and improving living conditions.
Russia
Russia has a significant, multi-faceted approach to infrastructure development, including investments from the National Wealth Fund (NWF) and various government programs focused on rural development and modernization. The NWF is being used to support projects like the Yamal LNG plant and others, while government programs focus on improving rural areas, healthcare, education, culture, and tourism.
Tajikistan
Tajikistan’s infrastructure development is significantly funded by the state budget and external financing, particularly from international financial institutions like the ADB and EBRD. The country’s infrastructure needs are substantial, with ongoing projects like the Rogun hydropower plant and road construction receiving substantial investment.
Turkmenistan

Turkmenistan’s 2025 state budget allocates US$11.42 billion for investments, with a significant portion directed towards infrastructure development. A large chunk of the investment, specifically 65.6%, will go to the production and technical sector, which includes infrastructure projects, while 34.4% will be allocated to the socio-cultural sphere. A substantial amount, US$214 million, is specifically earmarked for capital investments in buildings, structures, and engineering systems under the National Rural Program.
Uzbekistan
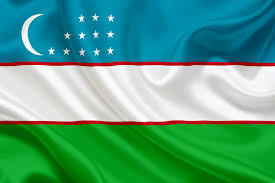
Uzbekistan is actively investing in infrastructure development, with a focus on attracting both public and private investment. The government is prioritizing projects in energy, transportation, and water management, often with the support of international financial institutions like the World Bank and the Asian Development Bank (ADB). A significant portion of the investment is channeled through public-private partnerships (PPPs), particularly in the energy sector.

It is difficult to compare EU and CIS infrastructure investments, as the EU tends to dress up its announcements in marketing style prose without providing substantial economic data. However, it should be noted that it cut itself off from the East by imposing significant border entry-exit restrictions along all of its borders with Russia and Belarus. Much of what was cross-border infrastructure between the two bodies is now dormant and is declining in standards.
It is possible that what would have been spent on sustaining and maintaining viable EU connectivity with the CIS bloc via air, land and sea has already been spent on Ukraine is now being allocated for EU defence and security budgets instead.
The CIS has taken a different approach. They are actively involved in developing their internal infrastructure, with major projects such as the International North-South Transport Corridor, the Trans-Afghan Railway, and huge amounts of money being spent on road, rail, and air connectivity all taking place. Cross-border facilities are being enlarged and freight capacity enhanced, with digital and blockchain technologies being introduced to help speed up transit times, both within the CIS and to border regional markets such as with the Middle East, Africa, China, ASEAN, India, and South East Asia.
We do not see similar developments in the EU.
The Euro

The Euro is also losing ground in international usage; it has recently been replaced by gold as the preferred second most held financial holding after the US dollar. Countries are also increasingly reluctant to use mechanisms such as the EU based SWIFT, or to hold significant financial reserves in Europe due to the risk of them being frozen or even used (as has happened to Russia’s reserves at Euroclear). The CIS is instead using its own currencies to facilitate internal trade and increasingly with far larger economies such as China. How this will affect the reliability of value of the Euro remains an unknown, but the initial signs point to a decline in international usage.
Common Debt

The European Union is increasingly in debt, with an average debt to GDP ratio of 81%. This compares with the CIS at 20.7%.
Economic Competitiveness
There are also economic competitiveness disparities. While there is considerable country and regional variation, in 2024, for a one-earner couple with two children, the average net annual earnings in the EU were €63,523, with a range from €23,375 in Bulgaria to €110,438 in Luxembourg.
This compares to an average for the same in the CIS of about €15,500, although again there are wide variations say for example between Russia (€23,375) and Tajikistan (€3,000). This means that while there is competitiveness in the EU labour market this is also true within the CIS. We suspect that an underlying reason for the mass immigration policies into the bloc (including Ukrainians) is to reduce the overall wage bill and keep manufacturing employment levels at a lower overall competitive rate.
However, as the overall CIS employment rate is lower still – by a considerable amount – as and when CIS global exports develop, the EU will come under further competitive pressures on the international markets.
In terms of corporate income tax (CIT) rates, these vary considerably across the EU but average out at 21.5%. This compares with the CIS with an average CIT rate of 16.33%. The average EU VAT rate is 21%, while among the CIS it is 16%.
Summary
Our research illustrates key trend drivers as regards EU and CIS comparisons, which suggest that if these remain constant, will reduce the current gap between their respective economic sizes. This will lead to increasing global competitiveness between the EU and the CIS.
These drivers are:
- The CIS has lower energy costs, and the EU rather higher overheads. This disparity is likely to remain and is a key component altering other competitive factors. The EU also has serious failure-risk points especially in terms of energy supplies from the Persian Gulf and is subject to more expensive alternative energy sources.
- The CIS appears committed to developing internal and connectivity infrastructure with Asia in ways that the EU is not. It is also a recipient of external funding sources, and especially China, in ways that the EU has rejected. Much CIS capital is being spend on developing trade-related infrastructure, whereas the EU is investing in defence.
- The CIS appears to have adopted a more versatile trade agreement policy which lends itself to making agreements with third partners in ways in which the EU is not.
- The CIS appears to have a less rigid and less elitist ministerial and executive structure, allowing more flexibility in its decision-making process.
- The EU has to spend more of its income to service current debt by quite a significant amount more than the CIS does. This debt is also growing.
- Over time, the respective manufacturing sectors will also begin to diverge, with CIS access to cheaper energy, personnel and tax overheads making it more competitive on global markets than the EU.
This subject is a significant geopolitical game-changer and requires substantially more research in order to draw definitive conclusions. Nonetheless, with the basic data contained within, based upon current growth patterns and related matters, the CIS is on track to attain economic parity with the EU within the next 25 years – and possibly earlier if economic fundamentals and investments remain as they are.
Related Reading
Commonwealth Of Independent States 2025 GDP Growth Data and Trade: Analysis