
 Русский








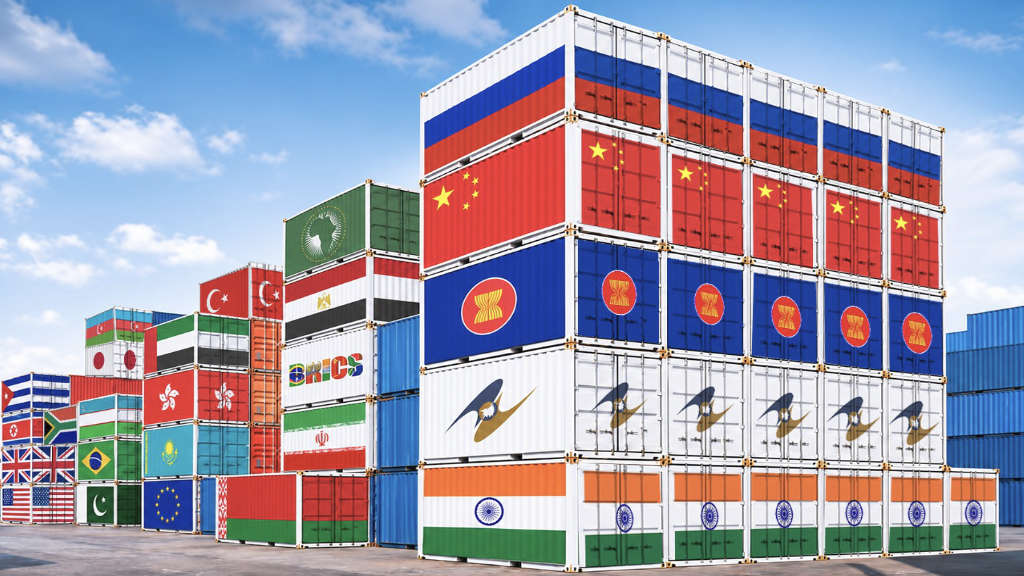

Russia’s foreign trade turnover reached US$576.2 billion in January-September 2026, representing a 13.9% year-on-year increase, as exports expanded to US$346.5 billion and imports climbed to US$229.7 billion. The resulting trade surplus amounted to US$116.8 billion, an increase of 13.2% compared with the corresponding period of 2025.
The expansion was accompanied by a substantial geographical redistribution of commercial activity: trade turnover with Asian countries increased 17.2%, while exports to the region rose 17.7% to US$277.5 billion and imports advanced 17.6% to $158.1 billion. The acceleration was particularly visible in the Russia-China commercial corridor. Bilateral merchandise trade reached US$242.485 billion during January-October 2026, increasing 32.1% year-on-year. Russian exports to China amounted to US$133.225 billion, up 31.5%, while Chinese supplies to Russia increased 33% to US$109.260 billion. These figures place the two countries’ commercial relationship among the principal drivers of Russia’s expanding Asian trade, alongside growing requirements for industrial machinery, transport equipment, metals, agricultural commodities and energy products.
A US$576.2 Billion Trade Turnover & An Increasing External Surplus
The Federal Customs Service (FCS) published its January-September foreign trade results on November 10, 2026. Merchandise exports increased by US$41.9 billion compared with the corresponding period of 2025, reaching US$346.5 billion against US$304.6 billion the previous year. Imports expanded by US$28.3 billion, from US$201.4 billion to US$229.7 billion.
Consequently, the positive trade balance increased from US$103.2 billion to US$116.8 billion, adding approximately US$13.6 billion to Russia’s external surplus. The growth rates of exports and imports were relatively close. Exports increased 13.7%, compared with 14.1% for imports. This distinction is important for understanding the commercial structure: Russia is increasing its export earnings while simultaneously purchasing more machinery, equipment, chemical products and other industrial goods from international suppliers.
This resulting expansion is therefore not simply an export-led increase in commodity shipments; it also reflects stronger demand for imported products required by domestic manufacturing, infrastructure, transport and industrial operations. Separate preliminary figures published by the Bank of Russia on November 11 placed the nine-month merchandise trade surplus at US$103.5 billion, up 21.1% year-on-year. Under this balance-of-payments methodology, exports reached US$355.2 billion, imports amounted to US$251.7 billion and total trade stood at US$606.9 billion, an increase of 16.3%.
The customs and central-bank totals represent different statistical accounting approaches and should be treated as separate series. Nevertheless, both demonstrate an expansion in merchandise trade and a positive external balance. The customs figures are particularly useful for analysing geographical and commodity composition, while the Central bank figures provide an additional perspective on the balance of payments.
Asia Takes 72.1% of Russia’s Foreign Trade
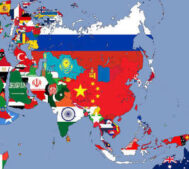
The geographical distribution of Russian trade provides the clearest indication of the changing structure of international commercial relations. Asian countries accounted for 72.1% of total Russian foreign trade turnover during the first nine months of 2026. Trade turnover with the region increased 17.2% year-on-year, substantially outperforming the growth recorded in Europe. Asian exports of US$277.5 billion represented approximately 80% of Russia’s total merchandise exports of US$346.5 billion. Imports from Asian economies reached US$158.1 billion. The resulting regional merchandise surplus was approximately US$119.4 billion, illustrating the importance of Asian markets in generating Russia’s overall external trade surplus.
Russia-Europe 10M 2026 Trade

Europe remained the second-largest regional trading destination, accounting for 16.4% of total turnover. Trade with European countries increased 5.4%. Russian exports to Europe reached US$44.5 billion, up 2.3%, while imports increased 8.9% to US$56.2 billion. The resulting US$11.7 billion deficit indicates that European purchases from Russia remained considerably smaller than Russian imports from the region.
Russia-Africa 10M 2026 Trade

African countries represented 3.3% of Russian foreign trade, with turnover increasing 0.2%. Russian exports to Africa declined 0.7% to US$15.8 billion, while imports from African countries increased 7.3% to US$3.6 billion. The resulting export surplus remained approximately US$12.2 billion.
North and South America Markets: US$8.6 Billion in Exports and US$11.7 Billion in Imports

North and South America collectively accounted for 3.3% of Russia’s foreign trade turnover during January-September 2026, with total regional trade declining 3.7% year-on-year. Russian exports to the American continent fell 7.8% to US$8.6 billion, while imports declined 1% to US$11.7 billion, producing a regional trade deficit of approximately US$3.1 billion. The Russian Federal Customs Service’s January-September 2026 figures do not separate the North American and South American totals but group them together.
Russia-United States 2026 Trade

Country-level statistics provide additional detail on the commercial relationship. The United States is the largest individually identifiable North American market in the available bilateral figures. Brazil provides the clearest substantial South American example. According to the US Census Bureau, US merchandise imports from Russia reached US$2.412 billion during the first nine months of 2026, down 24.6%, while US exports to Russia amounted to US$450.7 million, increasing 4.4%. Total bilateral goods trade consequently stood at approximately US$2.86 billion, leaving the United States with a US$1.96 billion trade deficit with Russia. Canadian statistics, meanwhile, showed that Canadian imports originating in Russia declined 44.1% to C$39.58 million during January-September 2026.
Russia-South America 2026 Trade
South America’s trade relationship was particularly significant in Brazil, where bilateral merchandise trade with Russia reached approximately US$8.96 billion during the first nine months. Brazilian exports to Russia amounted to US$1.31 billion, while imports from Russia reached US$7.65 billion, leaving Brazil with a US$6.35 billion trade deficit. Russian petroleum products accounted for approximately US$4.28 billion of Brazilian imports from Russia, while fertilisers contributed another US$2.06 billion. Brazilian exports included frozen beef, coffee and soybeans. These country-level figures demonstrate that the American continent’s commercial relationship with Russia comprises distinct market structures: energy and agricultural-input supplies are important in Brazil, while the US bilateral relationship has a different composition and a substantially smaller two-way trade volume.
Oceania: Australia and New Zealand in the Regional Trade Structure

Oceania accounted for a comparatively small share of Russia’s international merchandise trade. Russian imports from the entire region amounted to approximately US$100 million during January-September 2026, representing a 44.4% year-on-year increase. Australia and New Zealand, the two largest economies in Oceania, are the principal national markets to distinguish in a regional assessment. Australia’s economy has a strong mining, mineral, energy and agricultural export base, while New Zealand’s international commercial position is particularly associated with dairy, meat, forestry and food-processing industries. The US$100 million figure represents Russian imports from Oceania as a whole and should not be interpreted as total two-way trade or as the bilateral trade value of either Australia or New Zealand.
China-Russia Trade Reaches US$242.5 Billion In Ten Months
The most significant bilateral development was the acceleration of trade between Russia and China. According to China’s General Administration of Customs, merchandise trade between the two countries reached US$242.485 billion during January-October 2026, compared with the same ten-month period of 2025 representing an increase of US32.1%. Russian exports to China increased US31.5% to US$133.225 billion, while imports from China expanded 33% to US$109.260 billion. Russia therefore maintained a bilateral merchandise surplus of approximately US$23.97 billion.
These figures demonstrate that trade expansion is occurring in both directions rather than being driven exclusively by Russian commodity exports. The Russia-China growth rate of 32.1% exceeds the expansion of China’s overall international trade and its trade with the European Union and United States and reflects the growing importance of the two countries’ interconnected energy, industrial and transport supply chains.
For Russian exporters, China provides a major destination for petroleum, natural gas, coal, metals, chemical products and agricultural commodities. For Chinese manufacturers, the Russian market provides commercial opportunities in automobiles, industrial machinery, electrical equipment, electronics, construction machinery and consumer products.
The corporate landscape supporting these commercial sectors includes Russian companies such as Rosneft, Gazprom, NOVATEK, RUSAL, Norilsk Nickel, PhosAgro, Uralchem, Severstal and NLMK, alongside Chinese industrial and energy companies including CNPC, Sinopec, CNOOC, Sany, XCMG, Zoomlion, Sinotruk and Weichai. These companies represent important sectoral participants in the wider bilateral commercial ecosystem.
An additional indicator of the importance of the China corridor is the relationship between bilateral trade and Russia’s overall Asian exports. The US$242.5 billion bilateral total is equivalent to a substantial proportion of Russia’s US$277.5 billion exports to the entire Asian region, although the two figures cover different periods and different directions of trade and should not be directly compared as identical measures. The commercial significance extends beyond the immediate exchange of finished products. Industrial machinery imports support production, vehicle assembly, construction and infrastructure development, while Russian energy and mineral exports provide raw materials for Chinese industrial consumers. This creates a two-way supply relationship connecting energy producers, manufacturers, logistics operators, distributors and industrial customers.
Mineral Products Generate US$194.8 Billion in Export Earnings
Mineral products remained the foundation of Russia’s export economy during January-September 2026, generating US$194.8 billion, an increase of 14.3% year-on-year. They represented 56.2% of the country’s total merchandise exports. The category includes petroleum, natural gas, coal and other mineral commodities. Its dominance means that international energy prices, purchasing demand in Asian markets, tanker availability, pipeline capacity, freight charges and insurance costs continue to influence Russia’s export earnings and trade balance.
Higher international oil prices provided additional support during parts of the reporting period. The Urals crude price used for Russian taxation reportedly increased from US$67.11 per barrel in August to US$92.08 in September. This price movement helped improve the nominal value of mineral exports. However, export earnings and federal budget receipts are not interchangeable. Higher international prices do not automatically translate into equivalent increases in government revenue because production volumes, currency movements, discounts, transport costs and domestic fuel-market payments also influence the final result.
This distinction was illustrated by the reported 14.1% decline in federal oil and gas budget revenues during January-October compared with 2025, despite the increase in mineral export earnings during the first nine months. It demonstrates the importance of examining physical exports, realised prices and fiscal receipts separately. For Russian energy companies, the expanding Asian market remains commercially important. Rosneft and Gazprom are among the major operators associated with Russian oil and gas exports, while NOVATEK has an important position in liquefied natural gas. Gazprom’s pipeline exports to China through Power of Siberia, whose contracted annual capacity is designed to reach 38 billion cubic metres, provide an established infrastructure connection between Russian gas production and Chinese consumption.
Gazprom’s pipeline exports to China via the Power of Siberia gas pipeline ensure a stable infrastructural link between Russian gas production and Chinese consumption. The pipeline’s contracted capacity is 38 billion cubic meters per year – this level was reached in December 2024, and in 2025 supplies already exceeded the contracted volume, reaching 38.84 billion cubic meters.
Coal producers and exporters also participate in the Asian supply chain, with Far Eastern ports and railway infrastructure serving as important channels for shipments to China and other Asian markets. The next commercial challenge is to maintain export volumes and competitive prices while managing longer shipping distances, tanker availability, insurance expenses and market competition. The September price increase provided a strong contribution to export values, but sustainable earnings will depend on the relationship between commodity prices and the cost of delivering Russian products to overseas customers.
Metals Exports Increase 21.8% to US$63.5 Billion
Metals and metal products emerged as one of the strongest-performing major export categories. Russian exports in this sector increased 21.8% year-on-year to US$63.5 billion during the first nine months of 2026. The expansion was faster than the 14.3% growth in mineral products and the 15.6% increase in agricultural exports. It demonstrates the continuing international demand for Russian industrial materials and the importance of metals in the country’s export structure. The sector includes steel, aluminium, nickel, copper and other metal products used in construction, machinery manufacturing, automotive production, electrical infrastructure and industrial engineering.
Major Russian industrial producers include RUSAL in aluminium, Norilsk Nickel in nickel and other non-ferrous metals, NLMK, Severstal and MMK in steel, and Metalloinvest in iron ore and steel-related production. Their respective product categories connect Russian extraction and processing industries with international manufacturers and construction markets. The increase in metal exports also has implications for the development of higher-value industrial supply chains. Exporting processed metal products can generate greater domestic manufacturing activity than exporting unprocessed raw materials.
Demand from Asian construction, engineering, transport and manufacturing industries therefore creates opportunities for Russian producers to expand their range of semi-finished and processed products. Russian metal exports of US$63.5 billion were more than twice the US$31.8 billion generated by agricultural exports. Together with mineral products, the three leading export categories generated US$290.1 billion, accounting for approximately 83.7% of total merchandise exports. This concentration demonstrates the strength of Russia’s commodity and industrial-material export base, while also identifying the importance of expanding manufacturing and technology-intensive exports over the longer term.
Machinery Imports Reach US$112.4 Billion As Industrial Demand Expands
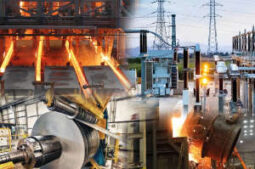
On the import side, machinery, equipment, transport vehicles and related goods represented the largest category, increasing 16.1% to US$112.4 billion. This category accounted for 48.9% of total imports, illustrating the scale of Russia’s continuing demand for industrial and technological equipment. The increase was larger in absolute terms than the growth in most other major import categories. The commercial importance of these purchases extends across manufacturing, construction, mining, energy, transportation, telecommunications and agricultural processing. Industrial machinery is required for factory modernisation, replacement of equipment, automation, production-line expansion and the development of new manufacturing facilities. Construction machinery supports housing, industrial parks, roads, railway infrastructure and energy projects. Transport equipment is required for freight operations, logistics companies, passenger transport and commercial vehicle fleets.
Asian manufacturers have become increasingly important suppliers in these markets. Chinese companies such as Sany, XCMG and Zoomlion are established international producers of construction and heavy machinery. Sinotruk and Weichai participate in commercial vehicle and powertrain markets, while Chinese automotive manufacturers including Chery, Geely and Great Wall Motor have expanded their international market presence.
These names illustrate the wider supplier landscape rather than a company-by-company allocation of the US$112.4 billion import category. Chemical products formed the second-largest import category, increasing 11.3% to US$44.8 billion. These products support manufacturing, pharmaceuticals, agriculture, industrial processing and other production activities. Agricultural products and food imports reached US$32.6 billion, increasing 4.3%. Textiles, textile products and footwear amounted to US$15.3 billion, up 11%. Imports of metals and metal products reached US$13.7 billion, an increase of 4.2%, while mineral product imports increased 2.5 times to US$7.3 billion. The expansion of machinery imports is particularly significant because it indicates that Russia’s external trade surplus is developing alongside a substantial inflow of productive goods. Imported equipment can support domestic output, industrial capacity and productivity, potentially strengthening future export capabilities. However, the 16.1% increase in machinery imports also demonstrates the importance of maintaining reliable foreign supplier relationships and competitive financing, payment and logistics arrangements.
Agricultural Trade: Exports Rise 15.6%, But Imports Remain Higher

Agriculture was another important contributor to Russia’s foreign trade expansion. Exports of food products and agricultural raw materials increased 15.6% to US$31.8 billion in January–September 2026. Imports rose more moderately, increasing 4.3% to US$32.6 billion. The resulting agricultural trade deficit was approximately US$800 million. This represents a relatively narrow gap between agricultural exports and imports, but it also indicates that the country’s position as a major agricultural exporter does not eliminate its dependence on imported food products and agricultural inputs.
The monthly development was uneven. Russia became a net exporter of agricultural products during January–March 2026, and exports subsequently exceeded imports in several months. However, imports again moved ahead in August and remained higher at the end of September. For comparison, agricultural exports in 2025 declined 4.1% to US$40.9 billion, while imports increased 15% to US$43.4 billion. The recovery in export growth during 2026 therefore represents an important improvement.
Russian agricultural companies and commodity traders, including Rusagro, EFKO, United Grain Company, Sodruzhestvo Group and Aston, operate across different segments of the country’s agricultural production, processing, vegetable oils and grain supply chains. Sunflower oil, wheat, barley, corn, vegetable oils and processed food products remain important components of Russia’s international agricultural commerce. Asian, Middle Eastern and African markets provide opportunities for expanding shipments, particularly through Black Sea and Far Eastern transport corridors. The growth of agricultural exports is also important for Russia’s commercial relations with developing economies, where demand for grain, vegetable oils, fertilisers and food-processing inputs remains substantial. Nevertheless, the US$800 million agricultural deficit shows that increasing export earnings must be accompanied by greater domestic production of imported agricultural inputs and food categories if Russia is to strengthen its overall position in this sector.
Chemical Products, Timber And Industrial Goods Complete the Export Structure

Beyond the three leading export categories, Russian chemical exports reached US$26.9 billion, increasing 8.1% during January-September 2026. The chemical industry is particularly important because it supplies fertilisers, industrial chemicals, polymers and other materials used by agriculture, manufacturing and construction.
Major Russian producers include PhosAgro, Uralchem, EuroChem and Sibur. Their industrial activities connect natural gas and mineral resources with higher-value chemical production, including fertilisers, polymers and petrochemical products. Growing demand for agricultural inputs in Asian, African and Middle Eastern markets provides commercial opportunities for Russian producers.
Exports of machinery, equipment, vehicles and other manufactured goods amounted to US$19.1 billion, although the category declined 0.6%. This contrasts with the 16.1% increase in machinery imports, highlighting the continuing difference between Russia’s position as an exporter of industrial raw materials and its dependence on imported machinery. Timber and pulp and paper exports declined 4.6% to US$7.6 billion. Textiles, textile products and footwear exports increased 12.2% to US$2.6 billion. These figures show that the expansion was not uniform across all industrial sectors. Metals, agriculture and mineral products recorded strong growth, while timber and machinery exports experienced declines. The contrast provides an important indication of where additional investment, processing capacity and international market development could have the greatest commercial impact.
European Energy Market Changes, & New Export Requirements

Although Asia now dominates Russia’s trade geography, European markets continue to represent a significant commercial relationship. The US$44.5 billion of Russian exports to Europe and US$56.2 billion of imports from European countries demonstrate that commercial exchanges have not disappeared. However, the composition and direction of these flows have changed substantially.
The energy sector faces additional structural adjustments. The European Union’s phased programme for ending Russian natural gas imports establishes January 1, 2027, as the deadline for prohibiting Russian LNG under long-term contracts. The remaining long-term pipeline gas imports are scheduled to end by September 30, 2027, with a possible extension to November 1, 2027, under specified storage conditions. The International Energy Agency estimates that the phase-out could reduce Russian pipeline and LNG deliveries to the EU by approximately 33 billion cubic metres annually between 2025 and 2028.
The commercial consequences extend to producers, shipping companies, LNG terminals, traders and infrastructure operators. Russia’s ability to redirect supplies towards Asian customers will depend on liquefaction capacity, pipeline infrastructure, shipping availability and long-term purchase arrangements. For NOVATEK, Gazprom and other Russian energy operators, the challenge involves developing alternative commercial destinations while maintaining production economics and transport efficiency.
Business Significance: A Larger Asian Market And Expanding Industrial Supply Chains

The January-September figures demonstrate three interconnected developments in Russia’s international business environment. First, Asian, not European markets have become the principal source of export demand and the largest regional suppliers of imported products. Their 72.1% share of total turnover, combined with 17.2% growth in regional trade, establishes Asia as the central commercial geography of Russian foreign trade.
Second, the expansion is not limited to energy. Metals exports increased 21.8%, agricultural exports rose 15.6%, chemical exports advanced 8.1%, and machinery imports expanded 16.1%. These movements connect energy producers, metal manufacturers, agricultural traders, chemical companies, machinery suppliers and logistics operators in a wider industrial trading system.
Third, Russia’s trade relationship with China has acquired additional scale. The US$242.48 billion bilateral turnover for January-October represents a 32.1% increase, with both exports and imports expanding by more than 30%. For businesses, these developments create opportunities in industrial equipment procurement, energy supply, metal processing, fertiliser production, grain trading, transport services, warehousing, shipping and cross-border payments.
The commercial landscape includes major Russian producers such as Rosneft, Gazprom, NOVATEK, RUSAL, Norilsk Nickel, NLMK, Severstal, PhosAgro, Uralchem, EuroChem and Sibur, as well as international industrial suppliers and traders operating in Asian markets. Chinese manufacturers and energy companies, including CNPC, Sinopec, CNOOC, Sany, XCMG, Zoomlion, Sinotruk and Weichai, represent important elements of the wider Russia-China industrial and supply-chain environment. Indian, Turkish, Central Asian and Middle Eastern trading companies also have potential roles in the development of alternative procurement and distribution channels. The next stage of commercial expansion will depend on the ability to move beyond individual commodity shipments towards longer-term industrial supply relationships, processing partnerships, equipment servicing, manufacturing cooperation and logistics integration.
Summary: The Measurable Results Of Russia’s Trade Reorientation
Russia’s January-September 2026 foreign trade performance combines a US$576.2 billion turnover, US$346.5 billion in exports, US$229.7 billion in imports and a US$116.8 billion customs surplus. The Asian region generated US$277.5 billion in Russian exports and supplied US$158.1 billion in imports, while China-Russia bilateral trade reached US$242.48 billion in the first ten months.
Mineral products generated US$194.8 billion, metals contributed US$63.5 billion and agricultural products added US$31.8 billion. On the import side, machinery and equipment reached US$112.4 billion, chemical products amounted to US$44.8 billion and agricultural imports totalled US$32.6 billion.
The figures establish that Russia’s international trade is expanding through two parallel processes: the continued monetisation of energy and natural resources and the increasing procurement of industrial equipment, manufactured products and production inputs. The distinction between the two processes is commercially significant. Export earnings provide the financial foundation for international purchasing, while machinery and technology imports support industrial operations and domestic production.
The growing Asian relationship connects these two sides of the economy through increasingly substantial trade corridors. The central result of the first nine months of 2026 is therefore not simply a larger trade surplus. It is the emergence of a more Asia-centred foreign trade structure, supported by stronger Chinese commercial exchanges, expanding metal and agricultural exports, and rising imports of machinery and industrial equipment. For Russian businesses and international trading partners, the US$576.2 billion turnover provides the scale of the opportunity. The next measure of success will be whether this expansion translates into more diversified exports, higher domestic processing, stronger industrial productivity and longer-term commercial partnerships across Asia, the Middle East, Africa and other international markets.
This article was provided by M. Jahan, an analytical reporter for Russia’s Pivot To Asia. Contact: info@russiaspivottoasia.com