Русский


“Scenario conditions for the functioning of the Russian Federation’s economy, key parameters for the forecast of the Russian Federation’s socio-economic development, and projected changes in prices (tariffs) for goods and services provided by economic entities engaged in regulated activities in the infrastructure sector for 2027 and the planned period of 2028 and 2029”
Introduction
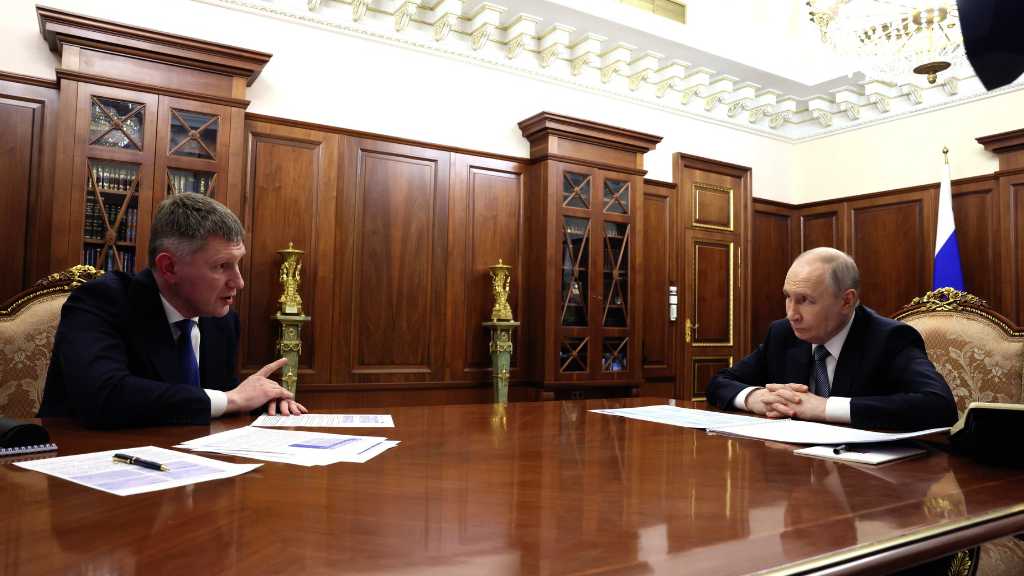
This is an unofficial translation of the document titled above, provided by the Russian Ministry of Economic Development and discussed between President Putin and the Economic Development Minister this week. Note we are unable to fully verify the translation accuracy, meaning that caution should be exercised when referring to specific data. Please also note our comments, marked ‘RPA’ to further explain specific issues. An executive summary is provided at the end.
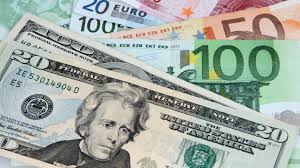
The Ministry of Economic Development of the Russian Federation has developed scenario conditions for the functioning of the Russian Federation’s economy and the main parameters of the forecast for Russia’s socio-economic development for 2026, and the planning period for 2027, 2028 and 2029. The scenario conditions are presented in two versions: the baseline scenario and the conservative scenario. The baseline scenario represents the most likely scenario for the development of the Russian economy. The conservative scenario is based on the assumption of deteriorating external economic conditions. In this article the quotes made are sourced from the document at length, as well as additional Ministerial comment and our own considered opinions.
Global Economic Development

The growth of global GDP in 2025, as well as the previous year, averaged 3.4%. According to the International Monetary Fund’s (IMF, part of the World Bank) April 2026 forecast, the growth rate of the global economy in the coming years will exceed 3% per year and will be 3.1% in 2026.
The conflict between the United States and Israel with Iran, which began in late February 2026, has caused an increase in prices on global commodity markets, which could lead to an increase in inflation, interest rates, and potentially create risks of a slowdown in economic growth. At the same time, medium-term forecasts for global economic growth remain moderate.
According to IMF estimates, global economic growth could remain at around 3.2% until 2029 (including 1.7% in developed countries and 4.1% in developing countries). There is an increasing focus on structural changes in the global economy, including geoeconomic fragmentation, the transformation of global value chains, and the rapid development of new technologies. These processes are creating new areas of economic and investment activity.
RPA: Please note that although Russia is a member of the IMF, while continuing to receive economic data from it and providingdata on the Russian Federation, the IMF was forced to refrain from visiting Russia and, has been unable to independently verify or interview Russian officials. Instead, Western governments and media have opted to rely on data provided by the Kyiv School of Economics (KSE) in Ukraine as concerns contemporary Russian fiscal data. It should be noted that the KSE has no representation in Russia and has obvious strategic bias. It is far from impartial, yet the West treats its Russia forecasts as accurate. We believe that this is one of the reasons why the West is still largely unaware of the true statusof the Russian economy and the main reason for the constant underestimation of the country’s real economic performance. Western political rhetoric has replaced real statistical data as an analytical tool.
The US economy is projected to accelerate from 2.1% in 2025 to 2.3% in 2026, supported by fiscal stimulus. The impact of increased trade barriers will gradually diminish. In 2027-2028, growth is projected to reach 2.1%, including fiscal stimulus through tax incentives for corporate investment. The momentum associated with the accelerated growth of technology is expected to weaken, but it will continue to compensate for the decline in immigration and consumption. In 2029, the U.S. economy is projected to grow at a rate of 1.9 percent.
RPA: Interestingly, Russia still considers the U.S. economy as a reference point. While the U.S. economy remains dominant globally, Russia’s trade with the United States is minimal. At the same time, in our opinion, the Russian economy is based more on structures similar to the Chinese socialist model than on the solid capitalist model of the United States.
In 2025, the Eurozone economy increased by 1.4%. According to IMF estimates, the Eurozone’s GDP growth will decrease to 1.1% in 2026, reach 1.2% in 2027, and recover to 1.4% in 2028. In 2029, the Eurozone’s economic growth is projected to be 1.2%. Compared to other regions (North America and Asia), the Eurozone countries attract less investment related to technological development. The continued rise in energy prices will hinder growth in the manufacturing industry. Additional pressure will be exerted by the increase in the real exchange rate of the euro against the currencies of countries that export similar products. A slight acceleration in growth from 2027 may be due to the projected increase in government spending, primarily in Germany.
China’s economy grew by 5% in 2025, which was in line with the growth rate in 2024. According to international organizations, the maintenance of the previous year’s growth rate is attributed to stimulus measures and additional lending provided by state-owned banks for investment purposes. At the same time, the Chinese economy is expected to gradually slow down in the medium term, to 4.4% in 2026, 4% in 2027-2028, and 3.7% by 2029, due to structural factors such as declining population and aging demographics, as well as weakening domestic demand.
India’s GDP increased by 7.6% in 2025. The acceleration of growth compared to the previous year is due to the increase in domestic consumption in the second half of 2025. According to the IMF’s forecast, the growth rate will decrease to 6.5% in 2026-2029 due to the lag in innovation compared to competitors and new restrictions on expanding foreign economic potential.
Global trade in goods and services increased by 5.1% in 2025. In 2026, the IMF estimates that growth will slow to 2.8% due to the conflict in the Persian Gulf. In 2027, growth will recover to 3.8%, and in 2028-2029, it will be around 3.1 – 3.2% per year.
High levels of trade protectionism are expected to persist. As a result of U.S. foreign policy, global trade flows will continue to shift from China to countries in Asia, Africa, and Latin America.
In the face of global economic fragmentation, high risks, and rising costs, regionalization of value chains and the redistribution of trade and investment flows through “connecting” economies will intensify.
RPA: As China has increased its added value and domestic production chains, the cost of manufacturing in China has increased for global export markets. Global manufacturers are now seeking to produce goods in other countries. The challenge is to balance the lower costs in these emerging markets with lower labor productivity. However, this scenario is not new and has already been implemented by countries such as Vietnam, which is now competing with China in both price and productivity. This move also involves increasing foreign direct investment in these markets. It is worth noting that Russia and China are already referring to Asia, Africa, and Latin America as the “Global South” and are actively establishing diplomatic ties in these regions. Note that these countries maintain concerns about the US’s ultracapitalism and Europe’s past colonial legacy, issues neither China nor Russia have to contend with.
The following structural shifts are expected to persist or intensify: an increase in the share of services in total exports of goods and services, including digital services, as well as a faster growth in trade in products related to the development of artificial intelligence, and a decrease in the share of trade in intermediate goods in total trade due to disruptions in supply chains and increased risks.
Global inflation in 2025 was 4.1% on average per year. Against the background of the Gulf conflict and the observed increase in commodity prices, consumer price growth is expected to accelerate to 4.4% in 2026, and then slow down to 3.2% on average per year.
Global Financial and Commodity Markets
In 2025 and early 2026, there was a gradual easing of monetary policy by leading central banks, following a period of significant tightening in 2022-2024. This contributed to improved financing conditions in global capital markets. Government bond yields remained elevated due to significant government borrowing.
The development of global financial markets will be influenced by a combination of macroeconomic and geopolitical factors. In the event of further easing of monetary policy in the leading economies, we can expect improved financing conditions and support for investment activity. However, the persistence of high levels of public debt, increased geoeconomic fragmentation, and ongoing volatility in currency, debt, and commodity markets will remain sources of potential instability. As geopolitical risks increase, we can expect continued diversification of international reserves and a gradual increase in the role of alternative assets, including gold and currencies of individual developing countries.
According to the World Bank, the price of Brent crude oil decreased by 14% in 2025 compared to 2024, reaching $69 per barrel, due to high oil production levels from both OPEC+ and non-OPEC+ countries. The price of oil was also affected by unstable global demand amid escalating trade wars.
In 2026, the price of Brent crude oil is expected to reach $81 per barrel, while the average annual price is projected to decrease to $61 per barrel by 2029.
RPA: This means that oil prices are likely to remain volatile over the next three years. As a result, more countries are likely to want to secure their energy supply chains by partnering with Russia.
In 2025, average natural gas prices increased by 9% to $428 per thousand cubic meters at Europe’s largest trading terminal, TTF. This increase occurred amidst the structural transformation of the European energy market, driven by restrictions on natural gas imports from Russia and increased purchases of LNG to compensate for the loss of Russian pipeline gas. In 2026, the average natural gas price is expected to remain be $432 per thousand cubic meters due to cold weather conditions and the Middle East conflict. In the long term, until 2029, the price is expected to decrease, mainly due to projected increases in global LNG production.
Wheat prices have increased by 1% to $260 per ton due to slower exports from Russia and the EU, as well as geopolitical tensions. Corn prices rose by 0.5% to $204 per ton due to lower annual production in Argentina and the United States. Pork prices rose by 1% to $2,945 per ton, while chicken prices rose by 0.4% to $1,843 per ton amid worsening epizootic conditions in key producing countries (China and Europe) and a decline in livestock numbers in the United States. Meanwhile, in 2025, vegetable oil prices decreased (by 4% to $1,160 per ton), driven by increased global supply of competing oils and stable consumption. Sugar prices also decreased (by 4% to $489 per ton) due to increased production in India, China, and Brazil.
According to the Food and Agriculture Organization of the United Nations (FAO), global prices for wheat, corn, and meat increased in 2025, while prices for vegetable oils and sugar decreased.
According to the FAO, against the background of geopolitical risks and deterioration of production indicators in the main regions in 2026 and beyond, world prices for wheat are expected to rise (by 1% to $262 per ton in 2026 and by 7.7% by 2029), corn (by 1% to $206 per ton in 2026 and by 5.4% by 2029), vegetable oil (by 1% to 1,168 US dollars per ton in 2026 and by 4.6% by 2029), sugar (by 4% to 507 US dollars per ton in 2026 and by 9.0% by 2029 year). At the same time, due to positive estimates of production volumes, prices for pork are expected to decrease (by 5% to $2,809 per ton in 2026, by 2029 prices will be 1.6% lower than in 2025) and chicken meat (by 5% to $1,776 per ton in 2026 by 2029, prices will be 2.4 percent lower than in 2025).
RPA: This trend is likely to lead to more countries turning to Russia to fulfil at least some of their food security needs, as global prices rise and Russian grains become increasingly price competitive. Moscow can be expected to respond by seeking long-term contracts.
According to FAO data, the production of oilseeds and vegetable oils will increase by 4.4% in 2029 compared to 2025, sugar production will increase by 4.0%, wheat production will increase by 4.2%, meat production will increase by 4.6%, and dairy production will increase by 9.4%.
Russia’s Internal Conditions

In 2025, the growth of the Russian economy slowed to just 1%. However, over a three-year period (2023-2025), GDP increased by more than 10% in real terms (including 4.9% in 2024 and 4.1% in 2023). The main driver of growth was domestic demand, both consumer and investment.
Investments in fixed assets decreased by 2.3% in 2025 (the latest available official statistics) relative to the high base of previous years. Over the period from 2021 to 2024, investments increased by 37.9% (including an increase of 8.4% in 2024 and 9.8% in 2023).
The growth of consumer activity continued to slow down in early 2026. The total turnover of retail trade, public catering, and paid services to the population increased by 3.5% in January-March of this year, following an increase of 4.0% in total for 2025. Growth continues at a relatively high rate, with a 7.1% increase in total turnover in 2024 and an 8.0% increase in 2023.
The increase in consumer activity was driven by higher household incomes, which continued to grow. However, a significant portion of household income was not converted into consumer demand, but rather saved, resulting in a historically high savings rate of 16.6% in 2025.
RPA: This is a high level of domestic savings, and the Russian government has not yet fully utilized this financial resource. For comparison, the average savings rate in the United States is 8.3%, while in the Eurozone it is 14.4%, and these rates have been declining recently. The mobilization of domestic savings is a key but currently untapped resource.
In Russia, real disposable monetary incomes of the population increased by 7.4% in 2025 (the latest available data from official statistics). The main contribution to the dynamics of incomes was made by labor incomes, property incomes, and entrepreneurial incomes. Real wages increased by 4.4% in 2025 relative to the high base of previous years (by 9.7% in 2024 and by 8.2% in 2023).
The increase in wages is observed against the backdrop of historically low unemployment. The unemployment rate averaged 2.2% of the workforce in 2025 (reaching a low of 2.1% in some months), compared to 2.5% in 2024 and 3.2% in 2023.
The slowdown in demand growth was accompanied by a decrease in prices in the real sector. For example, the producer price index for industrial goods decreased by 3.3% from December 2024 to December 2025. The main factor was a decrease in prices in the extraction of minerals, which was caused by the dynamics of global oil prices. At the same time, prices also decreased in manufacturing (by 0.3% December-to-December). This negative trend was recorded after a period of high growth rates in producer prices (7.9% December-to-December in 2024 and 19.2% December-to-December in 2023).
Inflation slowed to 5.6% year-on-year in December 2025, down from 9.5% in 2024 and 7.4% in 2023. The food segment contributed significantly to the slowdown in inflation in 2025, with prices rising by 5.2% compared to 11.0% a year earlier. Prices for non-food products increased by 3.0% in 2025, after increasing by 6.1% in 2024, while prices for services increased by 9.3%, after increasing by 11.5% a year earlier. However, the main slowdown in inflation compared to the previous year occurred in November and December 2025.
RPA: Note that in 2025, the increase in prices for non-food products was lower than the actual inflation rate. This means that they became cheaper in real terms. This is also a positive indicator of Russia’s efforts to combat inflation.
In terms of industry, manufacturing, construction, and agriculture contributed positively to GDP growth in 2025. On the other hand, mining and wholesale trade contributed negatively.
In 2025, industrial production continued to be one of the key drivers of economic growth, with an increase of 1.3% (compared to 5.1% in 2024 and 4.3% in 2023).
The overall growth of the industry was driven by manufacturing. In 2025, manufacturing enterprises increased their output by 3.6% (compared to 9.1% in 2024 and 8.7% in 2023). The main contributor to the growth of manufacturing was the engineering industry, which increased its output by 7.7% in 2025, compared to 19.8% in 2024 and 25.0% in 2023.
RPA: While Russia’s industrial output is positive, it is limited by a shortage of skilled and semi-skilled workers, exacerbated by low unemployment rates. This remains a challenge for the budget. Russia is attempting to address this by attracting labor from Asia. The trend of workers from conflict zones in the Middle East moving to Russia, as well as economic migrants from India and Pakistan, will require time to integrate into the Russian economy, but the process has already begun.
At the same time, in 2025, the reduction in mineral extraction continued, by 1.6% after a decrease of 0.5% in 2024 and 1.0% in 2023.
Agricultural output increased by 4.9% in 2025 (after a decrease of 3.3% in 2024 and a growth of 0.2% in 2023). In 2025, the gross harvest of grain (including corn) in all categories of farms exceeded the previous year’s level by 12.1% after a decrease of 13.2% and 8.0% in 2024 and 2023, respectively. As of December 2025, the number of cattle in all categories of farms decreased by 3.5% compared to the same period last year, after decreasing by 4.9% and 2.4% in 2024 and 2023, respectively.
Against the backdrop of a slowdown in economic activity, transport turnover decreased by 0.7% in 2025, following a 0.5% increase in 2024 and a 0.6% decrease in 2023.
RPA: The slight decline in cargo transportation in Russia can be attributed to the restructuring of supply chains, unresolved infrastructure issues, a lack of available transportation vehicles, and changes in global distribution networks. It is worth noting that Russia has committed to making significant investments in infrastructure and transportation at the national level, and this will begin to improve the situation starting in 2026. Essentially, Russia is following the Chinese model of developing domestic infrastructure and the Belt and Road Initiative, ultimately extending it to the entire Eurasian region.
The growth of the volume of work in the construction industry also slowed down, with an increase of 2.5% in 2025, compared to 3.8% in 2024 and 9.0% in 2023.
The Baseline Scenario: Expected Russian Economic Development In 2026

The macroeconomic parameters of the baseline scenario are calculated under more stringent monetary conditions than were considered when developing the forecast for socioeconomic development in the fall of 2025. The Bank of Russia’s current estimates for the key interest rate for 2026 are 14.0 – 14.5% on average, compared to 12.0 – 13.0% in September 2025.
As a result of these development trends, the baseline scenario predicts a 0.4% increase in real GDP compared to 2025. Russia’s nominal GDP is expected to increase by ₽13.7 trillion ($184.7 billion) over the year, reaching ₽228 trillion ($3.07 trillion). The positive trade balance in 2026 is estimated at $133.6 billion.
The ruble will strengthen and amount to an average ₽81.5 against the US dollar. (It was ₽83.4 per US dollar in 2025).
Inflation will continue to slow down and will reach 5.2% by the end of 2026.
Taking into account the slowdown in consumer activity recorded at the beginning of the year, the total turnover of retail trade, public catering, and paid services to the population will increase by 1.2% in 2026 (compared to 4.0% in 2025), including a 0.8% increase in retail trade turnover (compared to 4.1% in 2025) and a 1.7% increase in paid services to the population (compared to 2.8% in 2025).
The slowdown in consumer demand growth will occur against the background of a slowdown in the growth of real disposable incomes of the population – an increase of 0.8% in 2026. At the same time, the growth of consumer activity will be supported by the accumulated savings of the population (the savings rate will decrease to 14.3 percent in 2026).
The volume of industrial production will increase by 0.6%, including manufacturing industry – by 1.0%.
RPA: This is comparable to the expected 0.5% growth in industrial production in the United States in 2026, although that is expected to improve, and the 0.2% growth in the European Union, which is projected to continue declining.
However, this will continue to reduce investment activity (by 1.5%) in the context of maintaining relatively expensive borrowed funds and reducing the profits of organizations (the net financial result in 2025 decreased by 3.9% after decreasing by 6.9% a year earlier).
The slowdown in consumer demand growth will occur against the backdrop of a slowdown in the growth of real disposable household income, with growth expected to be at 0.8% in 2026. At the same time, the growth of consumer activity will be supported by accumulated savings (the savings rate will decrease to 14.3% in 2026).
Against the backdrop of structural changes in the economy and the optimization of manufacturers’ costs, the unemployment rate will move away from historical lows in 2026 and will reach up to 2.4% of the workforce.
Medium-Term Forecast for 2027-2029
In the baseline scenario, economic growth will accelerate from 1.4% in 2027 to 2.4% in 2029. In nominal terms, GDP will exceed ₽270 trillion ($3.64 trillion) by the end of the forecast period.
However, global prices for fuel and energy commodities are expected to decrease in 2027. Under these conditions, Russian goods exports will decline by $17.5 billion to $424.7 billion, primarily due to oil and gas exports. By 2029, exports will increase to $464.4 billion. The share of non-oil and gas exports will increase to 56.3% in 2029 (from 50.2% in 2026).
RPA: A key point to note is the ongoing diversification of the Russian economy, which will result in the energy sector’s share of GDP declining by an average of 2% per year between 2026 and 2029. At current rates, this means that energy sector revenues will decrease by approximately $4.5 billion per year and be reallocated to other sectors, such as manufacturing and agriculture. This also means that the effectiveness of Western sanctions on Russia’s energy sector is diminishing.
Russia’s 2027 imports will increase by $13.5 billion to $322 billion, while by 2029 the volume of imports is estimated to increase to $353 billion.
As a result, the trade balance in 2027 will be $102.6 billion with a further increase to $111.1 billion in 2029.
The ruble will weaken: to 87.4 rubles per US dollar on average in 2027 and 96.0 rubles per US dollar on average in 2029.
RPA: The weakening of the ruble against the dollar will provide some relief for Russian exporters, who are suffering from both a strong ruble and rising prices for Russian exports, although the use of national currencies instead of the US dollar is somewhat mitigating the situation.
The consumer price index (inflation rate) will grow by 4% per year in line with the Bank of Russia’s target.
As monetary conditions ease, investment in fixed assets will resume growth in 2027 (at a rate of 2.0%). The decline in 2025-2026 will be offset in 2028. The cumulative growth for 2027-2029 is estimated at 7.7% in real terms.
Industrial production will grow by 2.1-2.5% per year.
The unemployment rate will stabilize at 2.3% of the workforce.
Consumer activity will accelerate. The growth in total retail trade turnover, commercial consumer services, and public catering will increase from 2.4% in 2027 to 3.1% in 2029, including a 2.3% increase in retail trade turnover in 2027 and a 3.1% increase in 2029.
The growth of consumer activity is projected against the backdrop of a decrease in the average propensity of the population to save (to 11.4% by 2029), as well as an acceleration in the growth of real disposable monetary incomes of the population (from 2.1% in 2027 to 2.7% in 2029).
RPA: This is a continuation of positive economic news. As mentioned above, the weakening of the ruble is beneficial for exports, and the expected decrease in inflation (to 4% by the end of 2027) means that interest rates will decrease, leading to a reduction in export financing (the gap between production costs and payment). The decrease in personal savings in Russia will also lead to an increase in the money supply in the Russian economy, triggering a mini-boom in consumption.
Risks
External conditions continue to pose risks of escalating geopolitical conflicts, with the main effect being an increase in the prices of energy resources and other categories of goods.
In the medium term, there are increasing risks of energy resource shortages, which will act as a constraint on the growth of the economies of many major countries (primarily in terms of a reduction in the production of petrochemical products, including fertilizers, agricultural products, and light industry). The overall decline in economic activity in these countries poses risks of reduced demand for certain Russian exports, particularly non-commodity non-energy goods.
Internal risks are associated with the continuation of tight monetary conditions. The key risk is the additional restrictions on investment resources amid a general cooling of the economy, a decrease in the financial performance of enterprises, and a low attractiveness of investment with a high risk-free return on deposits.
The decrease in the predictability of external factors may further contribute to an increase in the population’s propensity to save, which, combined with the risks of a decrease in the population’s income dynamics, may hinder consumer activity and economic growth in general.
The implementation of external and internal risks is taken into account in the conservative scenario.
Key Parameters of the Conservative Scenario

RPA: This is the bad-case scenario.
This scenario assumes a slowdown in the global economy and a decrease in demand for Russia’s commodity exports.
Oil prices, a significant revenue generator for Russia, will be lower than in the baseline scenario. The price of Brent crude oil in 2026 is estimated to be $9 per barrel lower than in the baseline scenario, at $72 per barrel. In the future, the downward trend will continue, and in 2029, the price will drop to $59 per barrel.
The volume of commodity exports will decrease more than the volume of imports (relative to the baseline), which will affect the trade balance and lead to a stronger weakening of the ruble.
RPA: Thisscenario is mixed, as aweakening of the ruble benefits Russian exports.
Fixed-asset investments will decrease by 3.5% in 2026. Growth will resume in 2027 (by 1.0%) and accelerate by 2029 (to 2.0%), with a cumulative growth rate of 4.6% over 2027-2029.
Industrial production is expected to decrease by 1.0% in real terms in 2026, and to increase by 5.8% in 2027-2029.
The unemployment rate is projected to be 2.5% of the workforce in 2026, and to stabilize at 2.4% in 2027-2029.
The increase in the real disposable income of the population will be 0.3-0.1 percentage points per year below the corresponding values of the base case.
As a result, GDP will decrease by 0.5% in real terms in 2026. Economic growth will resume in 2027 (by 0.7%) and accelerate by 2029 (to 1.9%). Overall,during the forecast period of 2027-2029, GDP is expected to increase by 3.9%.
RPA: The bad-case scenario indicates a general decline in Russia’s energy revenue in 2026, which will further impact the country’s domestic productivity amid a growing trend of Russian consumers preferring to save their income rather than invest it in the economy. However, given that it is already the fifth month of 2026, this prediction seems overly pessimistic. As for the projected revenues from the sale of energy resourcesso far this year, they have actually increased.
Russian Prices for Goods and Services

RPA: Russia’s planned expenditures on utilities, particularly in the domestic energy sector, have a significant impact on the country’s labor productivity. In this section, the Ministry of Economic Development aims to eliminate subsidies for energy prices for businesses and consumers, ultimately bringing them to a break-even point where Russian consumers’ costs equalize with production and delivery costs.
Regulated Prices and Tariffs in Russia’s Gas Supply Sector
In accordance with the long-term decisions made to ensure reliable natural gas supplies to all categories of consumers, as well as to continue implementing social gasification programs and connecting new regions to the Unified Gas Supply System, the indexation of wholesale gas prices for all categories of consumers in 2027-2029 will be increased by 3 percentage points above the projected inflation rate.
Taking into account the revaluation of inflation, the indexation of wholesale gas prices for all consumer categories will be 9.1% in 2027, 7.0% in 2028, and 7.0% in 2029.
To ensure the financial capacity for the infrastructure construction of gas distribution organizations under the regional gasification programs and the social gasification program, the indexation of gas transportation tariffs for gas distribution networks in 2027 will be higher than the indexation of the wholesale component of the gas price by 2 percentage points, and in 2028-2029 it will not exceed its level. At the same time, for individual regions and gas distribution organizations, the tariff will be determined based on economically justified investment costs and a special surcharge set by the regions.
Prices and tariffs in the electric power industry In connection with the implementation of major investment projects in the electric power industry, the increase in tariffs for the transmission of electric energy through the Unified National Electric Network (ENES) will be 14.7% in 2027, 12.0% in 2028, and 5.4% in 2029.
Taking into account the decisions made in the electric grid complex regarding the need to implement a reference principle for the formation of operating costs and to curb the growth of cross-subsidization, the indexation of tariffs for electric power transmission services by grid companies in 2027 will be 15.3% for the population and 13.0% for other consumers, and in 2028 it will be 11.2% for the population and 8.9% for other consumers. In 2029, the indexation of tariffs for electric power transmission services by grid companies for all categories of consumers will be 6.3%.
As a result, the expected growth rate of the final price of electricity for the population in 2027 will be 8.6%, in 2028 – 9.1%, in 2029 – 5.0%.
The parameters for indexing tariffs for electricity transmission services are indicated without taking into account the individual decisions of the Government of the Russian Federation adopted to eliminate local regulatory imbalances in certain regions, the decisions of the Federal Antimonopoly Service of Russia on approving the conclusion of agreements on the conditions for the implementation of regulated activities concluded in accordance with Government Decree No. 1416 of August 31, 2023, and the decisions of the Federal Antimonopoly Service of Russia on approving the applications of regional regulatory bodies to establish tariffs that differ from the maximum levels established by the Federal Antimonopoly Service of Russia.
Due to the establishment of electricity tariffs for the population and equivalent categories of consumers, with differentiation based on the volume of electricity consumption, the tariff indexation parameters for the population are specified for the first range of electricity consumption.
RPA: The first range of electricity consumption is up to 3,900 kWh per month. This range typically includes the majority of domestic consumers, with some estimates suggesting that approximately 95% of domestic consumers consume electricity within this range. When the consumption exceeds 3,900 kWh, the second range begins, and when the consumption is even higher, the third range begins.
Increases In Russian Utility Bills
In the period from 2027 to 2029, the indexation of tariffs for utilities provided by resource-supplying organizations in the areas of heat supply, water supply, and wastewater treatment will be based on the projected inflation rate, compensation for deviations in actual inflation from the previously projected inflation rate, the projected rate of change in prices (tariffs) in the gas supply and electricity sectors, as well as the formation of additional revenue for the implementation of investment programs for the modernization of utilities infrastructure (additional indexation of tariffs in these areas by 1.5% annually).
Taking this into account, in 2027-2028, the parameters of indexation of citizens’ fees for utilities will remain the same as in the forecast approved by the Government of the Russian Federation in September 2025. In 2029, the indexation will be 6.1%.
Tariffs for railway transportation Since 2025, the principles of long-term tariff regulation set out in the Order of the Government of the Russian Federation dated December 29, 2017 No. 2991-r, have been adjusted due to the transition to a new model of freight railway tariff indexation based on the composite index determined based on the cost structure of Russian Railways.
The tariff indexation parameters for freight rail transport will be 8.3% as of January 1, 2027, 6.0% as of January 1, 2028, and 4.9% as of January 1, 2029.
In 2027-2029, efforts will continue to achieve the break-even point for the passenger infrastructure complex.
The indexation of tariffs for infrastructure services for long-distance passenger transportation will be 9.2% as of January 1, 2027, 9.2% as of January 1, 2028, and 9.2% as of January 1, 2029.
At the same time, the parameters for the growth of tariffs for long-distance passenger transportation in the regulated segment will be 5.9% as of January 1, 2027, 5.9% as of January 1, 2028, and 5.9% as of January 1, 2029.
RPA: The reasons for the increase in service costs indicate that the government wishes to decrease the subsidizing the expenses of Russian consumers and businesses in both the energy and transportation sectors. Achieving such a balance is not easy, and it will face internal political and financial resistance.It should also be noted that while these tariffs indicate an increase in overhead costs for Russian consumers, the Russian government is also proposing to subsidize these costs for regional authorities. This will allow Moscow to increase its electricity and transportation supply charges in wealthier parts of the country (first- and second-tier cities where infrastructure is already being built), where it will be easier for citizens to absorb, while continuing to subsidize other regions. This will particularly affect the Far East, Russia’s new regionssuch as the Donbass, and less prosperous areas of the country.
Summary
The fiscal projection as provided by the Russian Ministry of Economic Development is an exhaustive document. It should be noted that the global premise within this is based on the UN International Monetary Fund (IMF) official data, which the Ministry has overlaid with its own analysis of Russia’s domestic data. This means that this cannot be explained away as ‘Russian propaganda’, despite that it includes Russian data. There would also be no need for the Ministry to attempt to bluff Putin with inaccurate statistics. It should also be noted that Putin is in regular touch with other Russian departments such as the Central Bank and Ministry of Finance, and that any attempts to provide deliberately inaccurate data would be harshly dealt with. The President quickly ejects officials who try to present unrealistic intelligence. This means that the document provided can be broadly relied upon as accurate. It is also notably devoid of any political rhetoric.
Of the two scenarios presented, the base scenario appears realistic, while elements of the conservative scenario are already proving to be overly cautious, such as Russia’s expected oil revenues. However, neither make any case for any ‘collapse’ of the Russian economy nor point to any wildly fluctuating positions, which would be symptomatic of structural problems.
Instead, both scenarios, expected and bad-case, showcase a Russian economy that while under substantial pressure, is consistent in its performance. This means that the Russian economy is under control and is closely managed to micro detail.
A final point is a best-case scenario. That has not been provided, although it can be taken for granted that Russia has economically-gamed requirements such as the restructuring and development of the Donbass and other Russian regions damaged by the Ukraine conflict, as well as providing a loosening of fiscal policy to cater for any ‘feelgood factor’ should the conflict come to an end.
While European politicians in particular seem adept at presenting losses as gains and insist on using phrases such as ‘unwavering commitment’, ‘continuing support’ and ‘European solidarity’ most do not go into any detail as regards their actual economic state of affairs. What is different about Russia is that this document has been made publicly available (in Russian) and is based upon data rather than political opinion. That difference neatly sums up the fiscal reporting credibility gap between what is happening in Europe, and what is happening in Russia.