 Русский







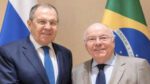
The recent history of the bilateral relationship between Russia and Brazil has key aspects that deserve to be highlighted. On one hand, two very powerful markets that stand as global hubs of international trade; on the other, from the platform of the BRICS bloc, a complementarity that enables significant expansion of the frontiers of trade for both countries. Analyzing official information from Brazil’s Ministry of Development, Industry, Trade and Services (MDIC), this article offers a perspective of the main axes of Brazil-Russia trade, looking at its roots, structure and future potential.
Cycles of bilateral trade
The Post-Soviet Foundation & Gradual Reconnection (1992–1999)
- Following the dissolution of the USSR, initial trade volumes between the newly formed Russian Federation and Brazil were small, often struggling below US$500 million annually.
- Both nations were focused on domestic economic restructurings (Russia’s transition market reforms and Brazil’s stabilization via the Plano Real). By the late 1990s, the blueprint for structural complementarity emerged: Brazil began replacing traditional buyers for raw goods like sugar and coffee, while Russia started supplying bulk fertilizers.
The Commodity Super-Cycle & BRICS Institutionalization (2000–2011)
- The turn of the century brought strong global economic growth, rising commodity prices, and the formalization of BRICS in 2006/2009.
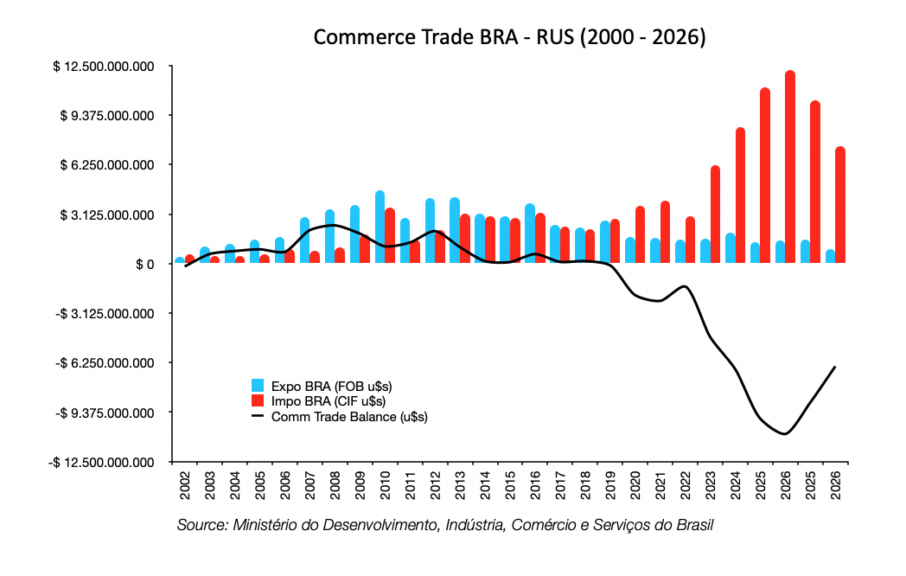
- Trade grew exponentially. Mutual turnover climbed toward US$5 billion by 2008. After a brief interruption caused by the 2008 global financial crisis, trade quickly rebounded to hit a cyclical peak of US$7.5 billion in 2011. Brazil solidified its role as a premier food exporter to Russia (especially beef, pork, and sugar), while Russia became indispensable to Brazil’s massive agribusiness complex as its primary fertilizer source.
Macroeconomic Stagnation & Sanctions Phase (2012–2020)
- This period saw economic shocks hit both nations simultaneously. Russia faced Western sanctions after 2014 alongside a collapse in global oil prices, while Brazil weathered a severe domestic political and economic crisis between 2015 and 2016. Trade volume experienced a prolonged stagnation and eventual decline, bottoming out during the supply-chain disruptions of the COVID-19 pandemic in 2020.
Geopolitical Realignment Boom (2021–2025)
- Escalating geopolitical tensions post-2022 led to a total reorientation of Russian energy and trade flows away from European markets.
- Rather than contracting, bilateral trade experienced an unprecedented boom. Trade surpassed the old 2011 record to hit US$7.5 billion in 2021 and surged to US$12.4 billion in 2024 and consolidated between US$11 billion and US$14.9 billion by 2025. Russia became the top supplier of diesel and refined petroleum products to Brazil while dramatically scaling up its fertilizer exports. The main driver to explain this leap is the Brazilian government’s decision not to join the sanctions imposed on Russia in the context of the war with Ukraine: in 2022 Russia jumped from 11th to 6th place among Brazil’s external suppliers, reaching 5th by 2025.
Leading products Russia imports from Brazil
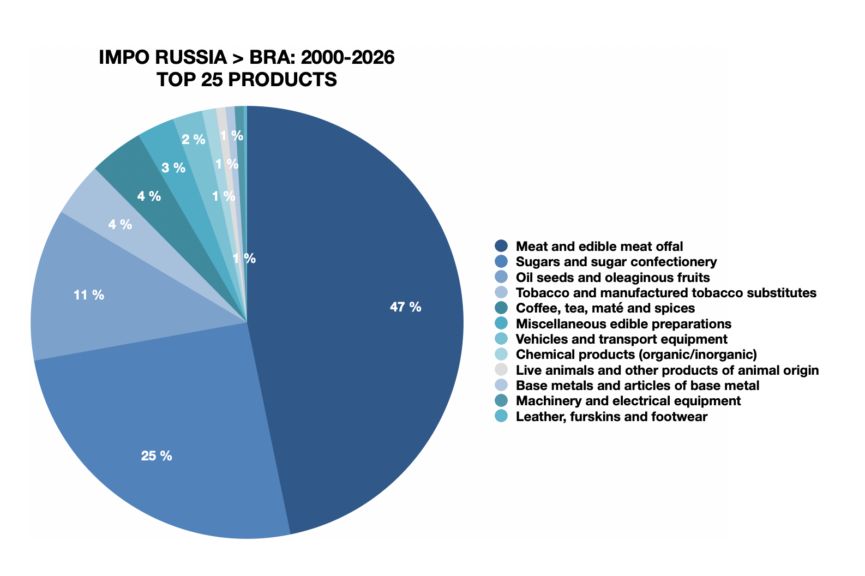
More than 93% of Brazilian output imported by Russia can be traced to eight categories: 44% meat and edible offal, 23% sugars and sugar confectionery, 10% oilseeds, meal, and pellets, 4% tobacco and manufactured tobacco substitutes, and another 4% coffee, tea, maté, and spices. Finally, 3% comes from miscellaneous food preparations, the same share from vehicles and transport equipment, and 2% from machinery and electrical equipment.
Within those categories, concentration is even sharper when looking at the top 25 Brazilian products imported by Russia: goods from the five leading categories alone account for 91% of that total, being meat, sugar, oilseeds, tobacco, and coffee.
Leading products Russia exports to Brazil
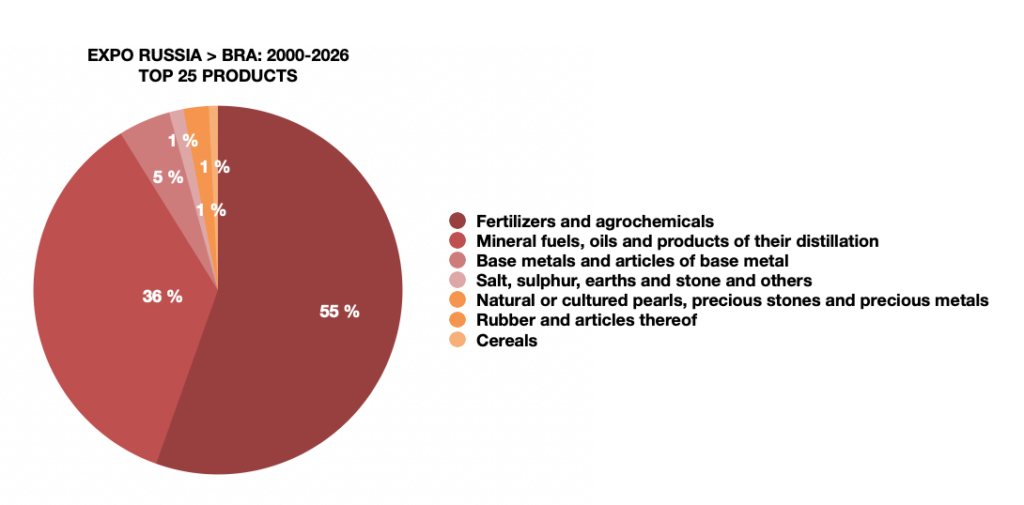
Similarly, the flow in the opposite direction shows an even sharper commercial concentration, both by broad category and by specific product. Of Russia’s total exports to Brazil over 2000-2026, 92% is explained by fertilizers and agrochemicals (52%), fuels and energy products (33%), and base metals and their manufactures (7%).
Looking ahead
In the decades ahead, new opportunities are emerging for BRICS partners to strengthen their trade ties. The complementarity of the bloc’s economies also opens the door to better terms, both because of the centrality this grouping has gained in recent years and because of the chance for cross-financing and support from other key partners such as China. One potential example is the electric vehicle industry: as it expands, this trio—a bloc within the bloc—opens a path still to be explored. Already under development, the option of building and nurturing a common platform could expose both countries to a growing and profitable cycle.
Reduced reliance on the dollar and the SWIFT system, as a way of streamlining trade and displacing the United States from its role as regulator, is also a way toward lower burdens and costs, allowing greater agility and dynamism, which points to a more favorable context for the years ahead.
This article was provided by Martin Epstein, an experienced economic analyst based in Argentina. He may be reached at info@russiaspivottoasia.com